As California prepares to share the May Revise updated state budget proposal from the Governor next month, it’s an opportunity to look back at historical information about the budget and caseload of the developmental disabilities system.
California’s proposed fiscal year (FY) 2026–27 budget released earlier this year includes $21.1 billion for developmental disability services.
Enacted Budget Graph
The graph below gives you a look at how our developmental disabilities services system’s budget has grown nearly seven-fold over the past 25 years.
- Orange line: funding for the Department of Developmental Services itself, include now-closed developmental centers, Porterville Developmental Center, Canyon Springs Community Facility, and the STAR homes located across California
- Green line: regional center operations—the cost of their employees and the information technology they use
- Grey line: purchase-of-services costs—these are the costs of services provided to support individuals and families
- Blue line: total of the other three lines
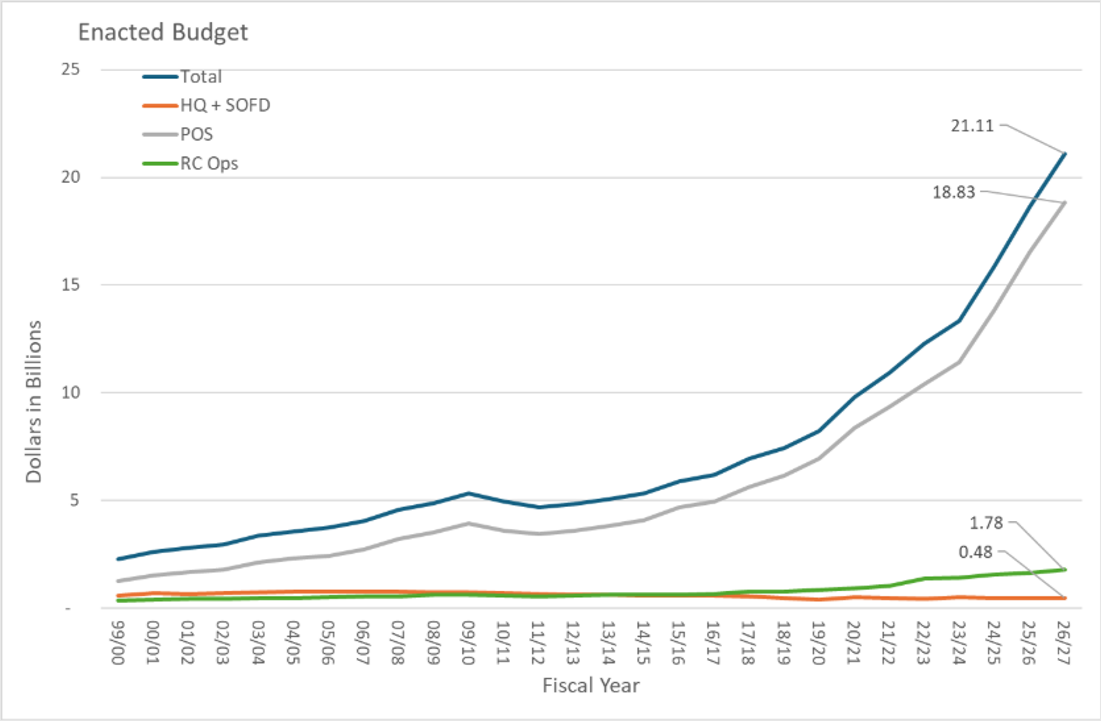
Total budget for the Department (state operations (HQ+SOFD as one line)), RC Ops, POS, and grand total.
The proposed budget fully funds the significant growth in developmental disability services. Caseloads continue to rise– we expect more than 60,000 new individuals this year and next. This is like adding an entire new regional center each year.
Caseload Graph
The graph below shows caseloads as of June 1 each year. Since 2000, the number of people supported by regional centers has tripled, from 170,000 to 487,000. Next year, 527,000 people are projected to be served.
- Purple line: The Self-Determination Program is projected to rise to nearly 12,000 people.
- Light blue line: Provisional eligibility is projected to support about 18,000 people.
- Yellow line: Caseload for Early Start, about 56,000 people
- Grey line: Lanterman Act eligibility is projected to reach 453,000 people next year.
- Dark blue line: total of all of the other lines
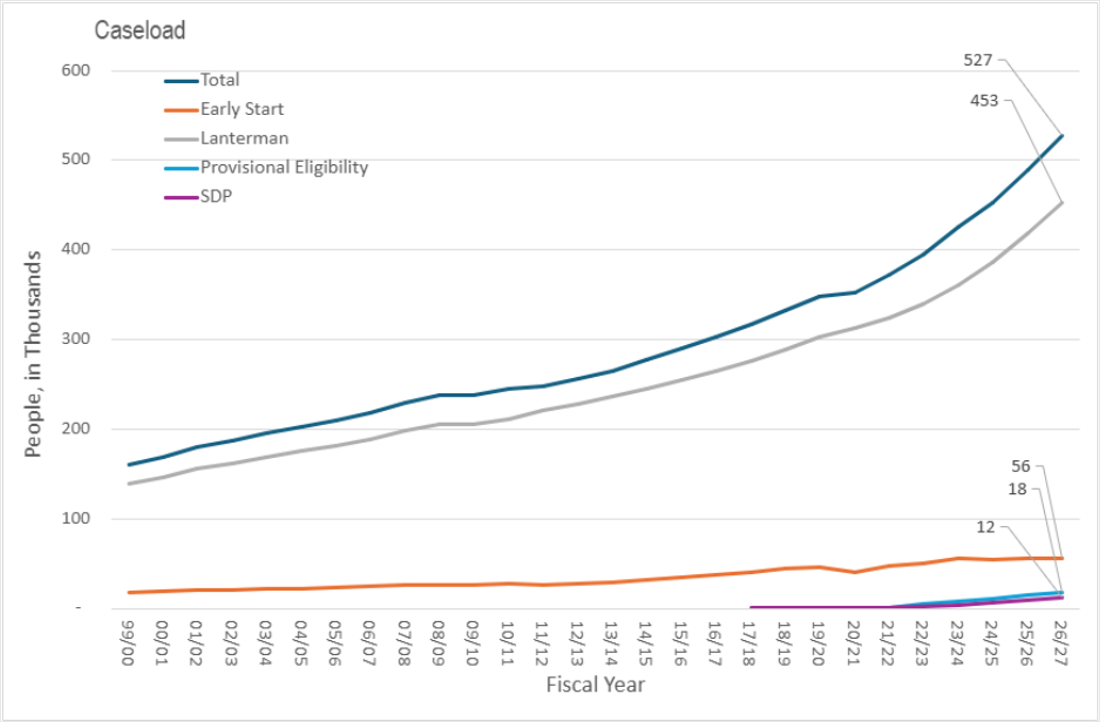
Caseload as of June 1 of each fiscal year. Provisional Eligibility was introduced in FY 2021/2022. Over the past 25 years, Lanterman and Early Start caseload shares have remained relatively stable, averaging about 84–89% and 11–15%, respectively. Status distributions for 2000–2010 are estimated by applying the 2005 caseload share by status to the total caseload in those years due to limited data availability.
Average Expenditure Graph
The final graph below shows how much, on average, regional centers spend per person to provide needed services and supports. After accounting only for inflation (see orange line), spending per person has more than doubled over the last 25 years (see distance between orange and blue lines). As raw numbers, average spending per person has increased from $7,500 per year to a projected $36,000 per year. There are many reasons for this, and whether someone lives at home or in a licensed facility makes a huge difference. The cost of living in a facility is nearly 10 times the cost of living at home, for example.
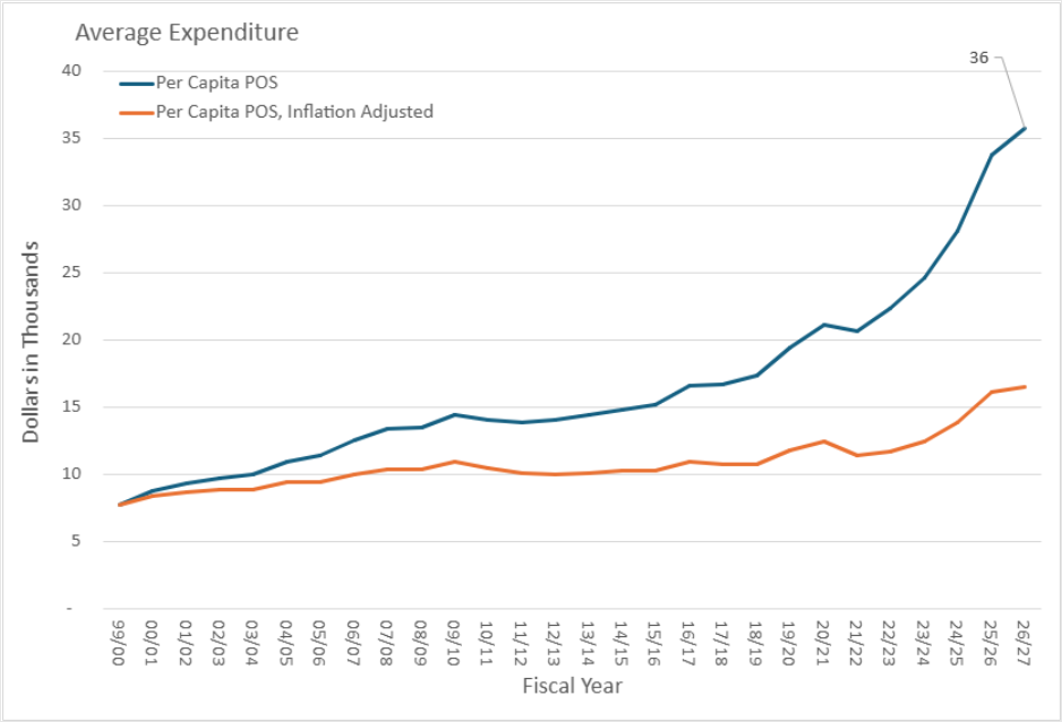
Per capita annual expenditure is calculated as total Regional Center fiscal-year expenditures divided by the number of consumers with some expenditures. Developmental Center expenditures and operating costs are not included. The orange line is the average expenditure adjusted by California’s Consumer Price Index-Urban published by the Department of Finance.