

Good information helps improve services. Every year, thousands of service providers across California collect information about how services support people with intellectual and developmental disabilities. Through the Quality Incentive Program (QIP), providers report information that helps show what’s working well, where there are challenges, and opportunities for improvement.
What Information Did Providers Share?
Last Fall, nearly 21,000 service providers shared information through the QIP, including:
- Provider Capacity: Workforce size, wages, languages spoken, types of providers, etc.
- Employment: Staff training, type(s) of employment attained, duration of employment
- Prevention and Wellness: Age/gender appropriate health screenings received, reasons health screenings were not completed
- Initial Provider Survey: Workforce size, wages, languages spoken, location
Providers also shared baseline information that will help measure progress over time.
What We Are Learning
The data collected over the last year shows:
- California’s direct support workforce continues to grow. Providers employed nearly 34,000 more Direct Support Professionals (DSPs) by the end of Fiscal Year 2024–25 than at the start of the year.
- Thousands of people who receive regional center services are working paid jobs in the community.
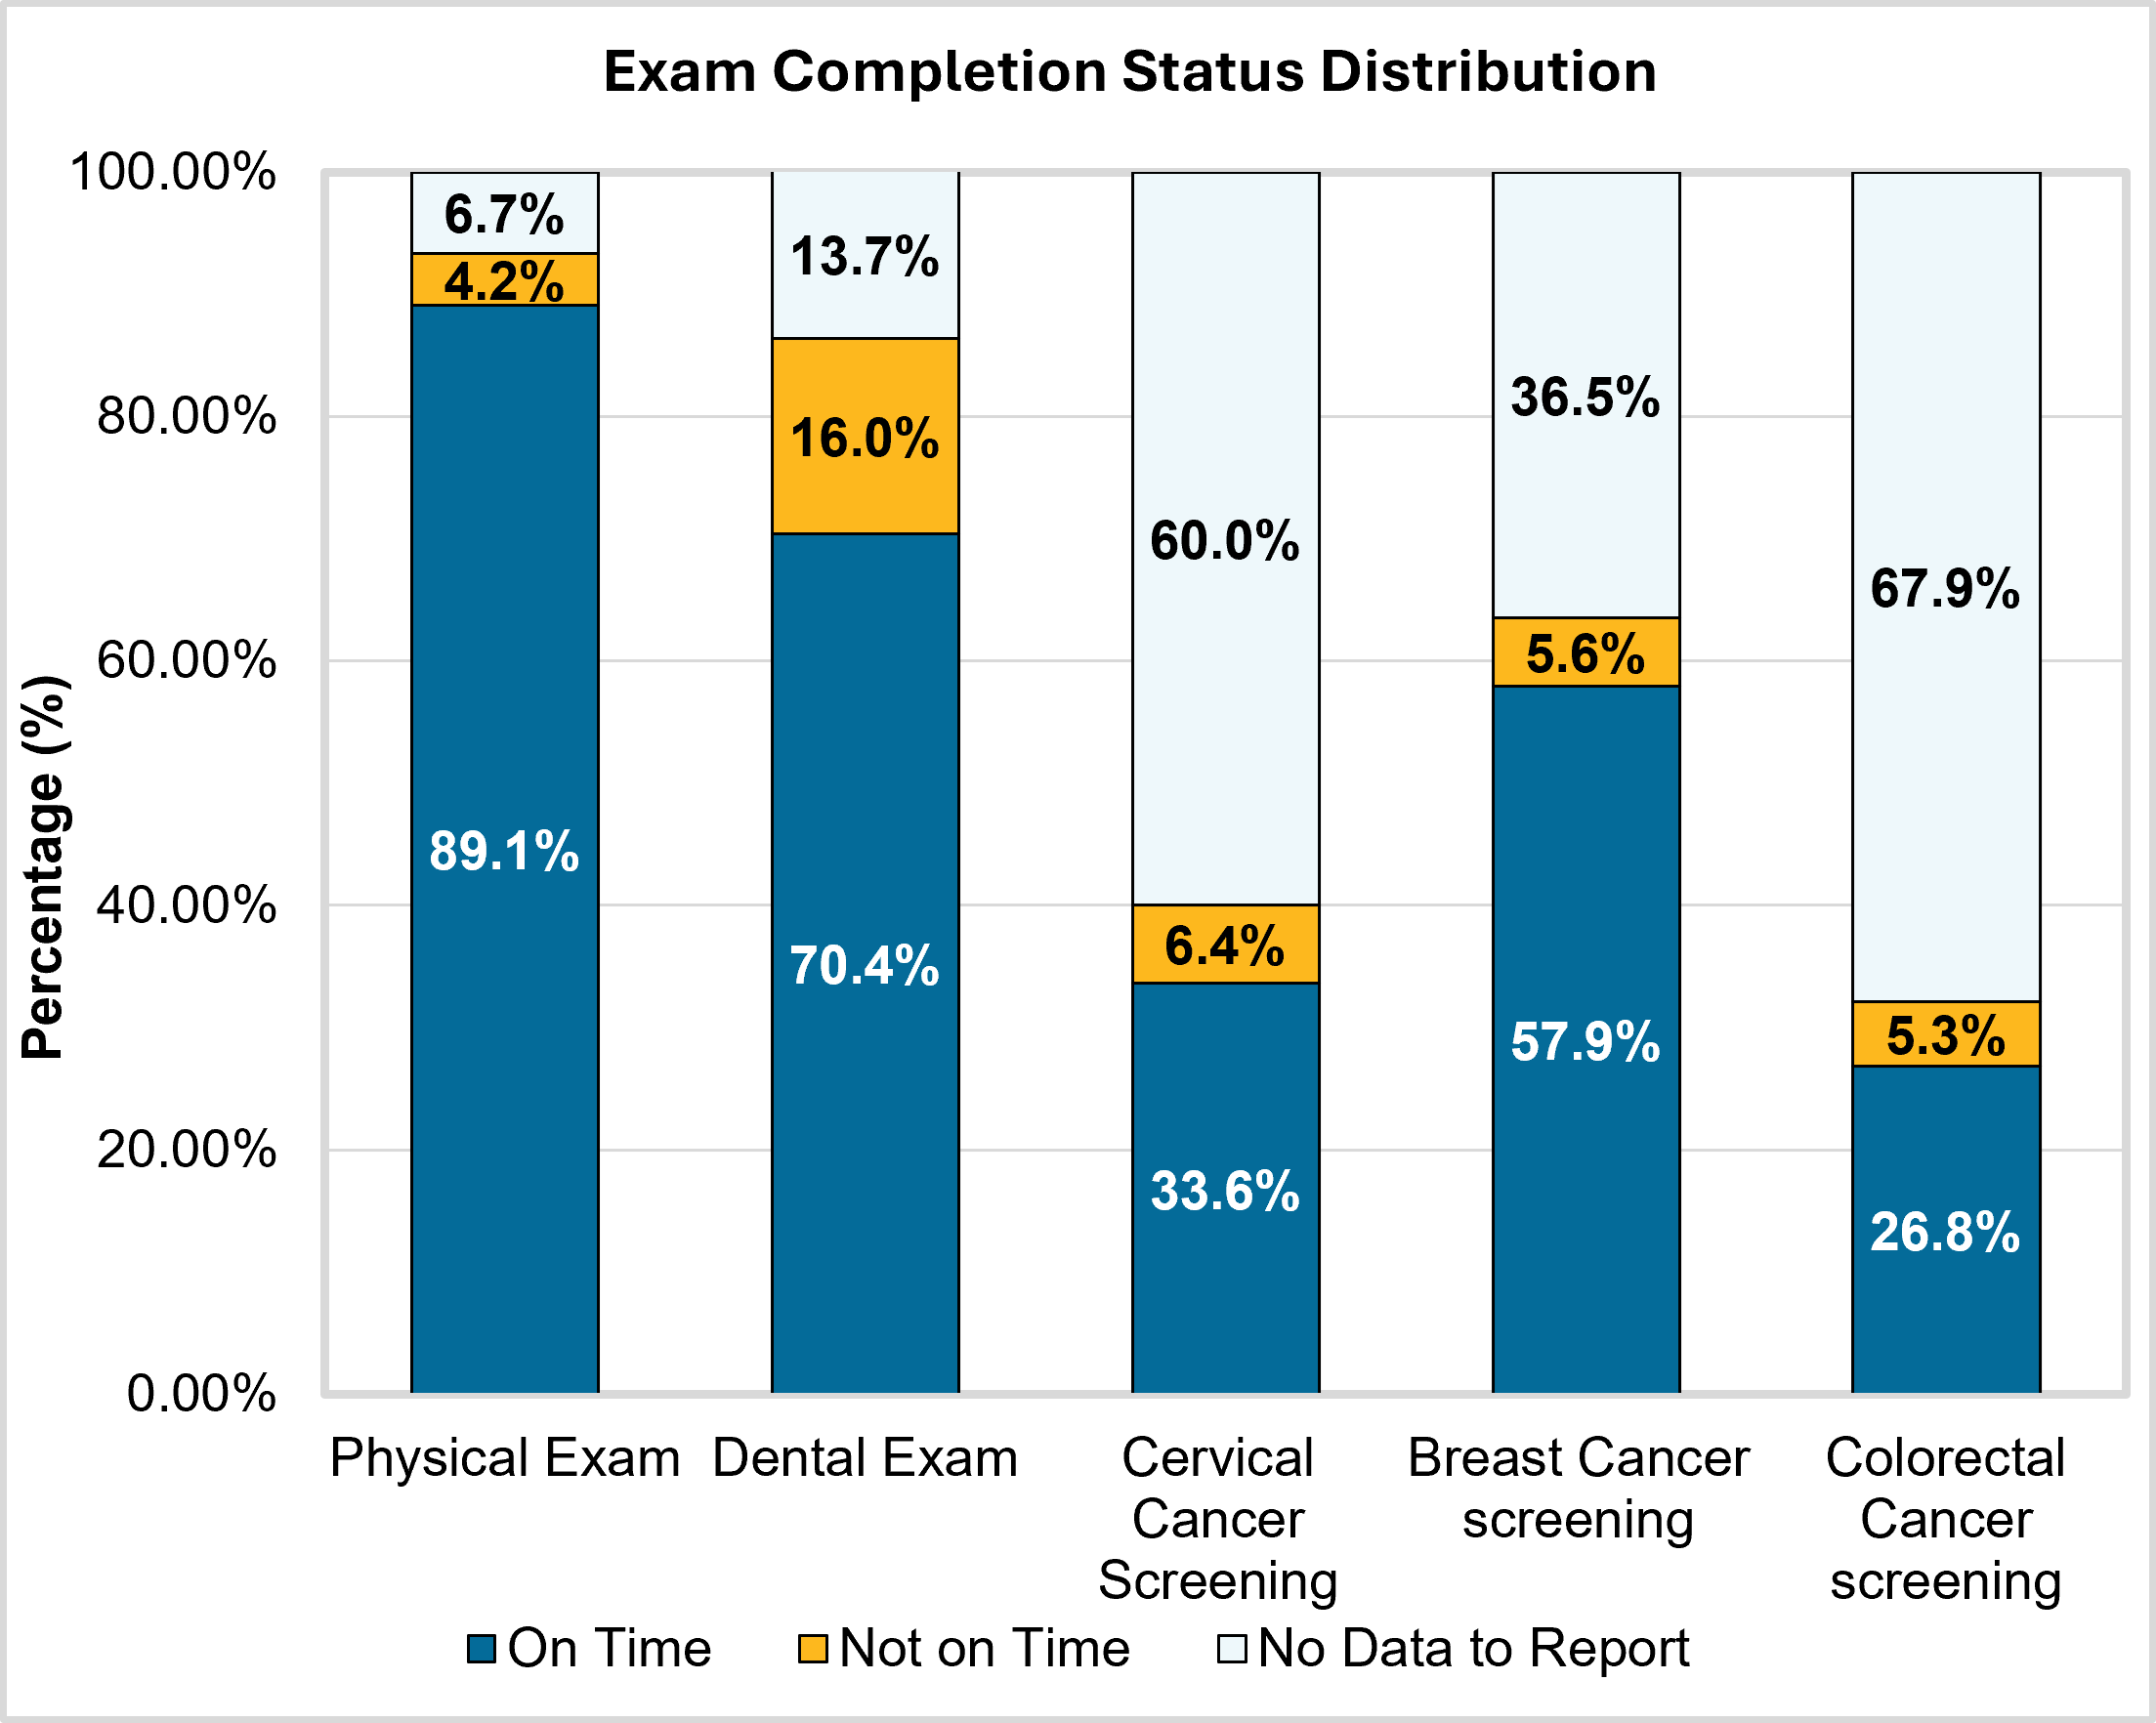
- More than 4,600 residential service providers submitted information for nearly 21,000 individuals receiving residential services. The data shows how often people receive recommended health screenings, including routine physical exams, dental visits, and cancer screenings.
How Will this Information Help to Improve Quality of Services?
While this is only one year of data, it represents an important milestone. As more information is collected over time, California will be able to:
- identify statewide trends
- measure progress
- improve employment supports
- Identify gaps in preventive health care
- continue improving the quality of services
This work is about more than collecting data. Every provider that participates in the Quality Incentive Program helps strengthen the developmental services system for the future.
What did we learn from collecting this data?
Employment:
Question: How many jobs do individuals have?
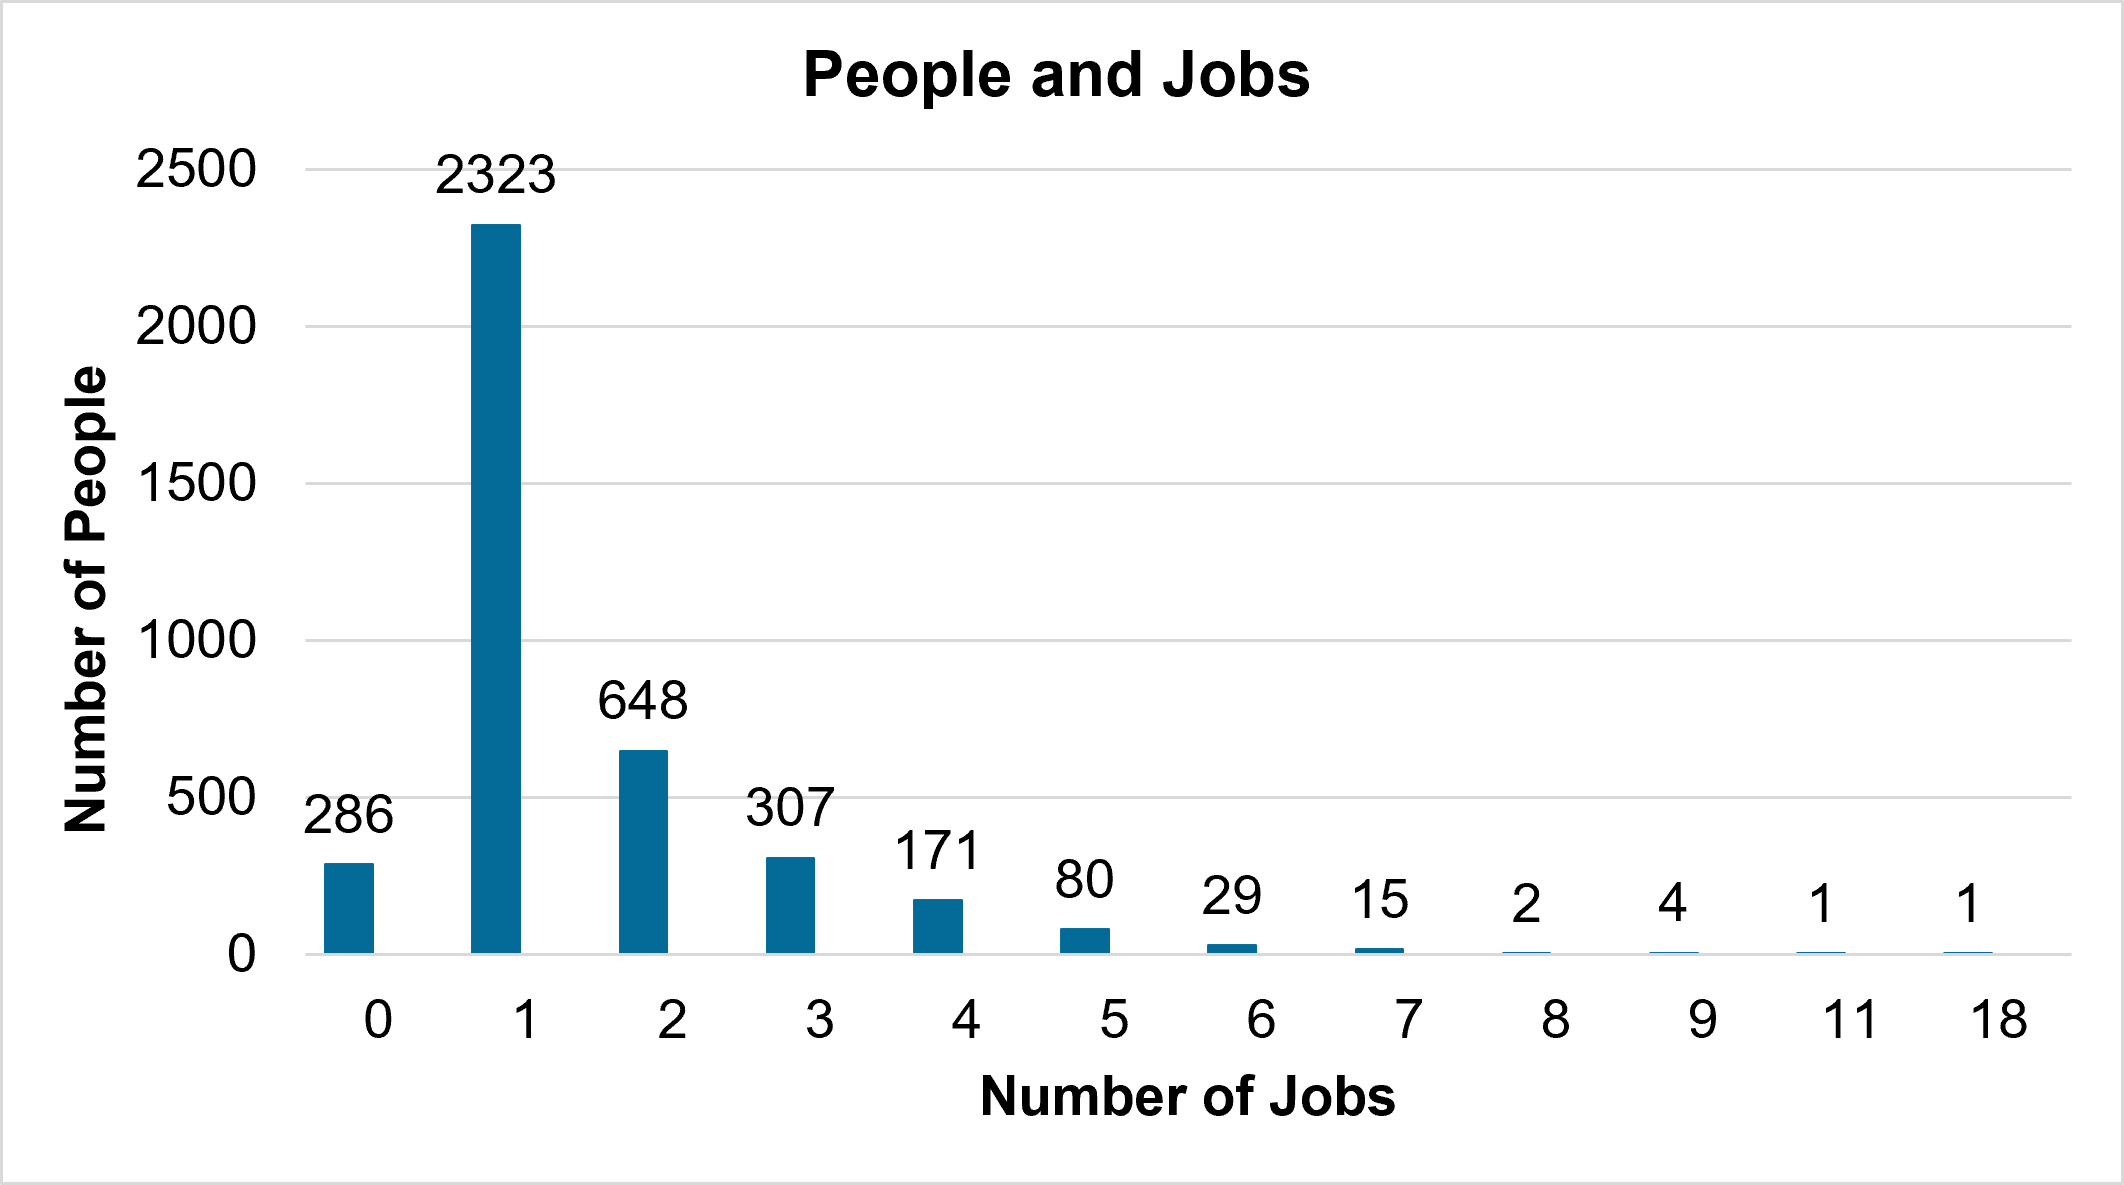
- Providers submitted data on the number of jobs for 3,867 individuals:
- Individuals ranged from having 0 – 18 jobs, with an average of 2 jobs reported.
- Providers reported not having job history for another 1,092 (22 percent) individuals, in addition to the 3,867 individuals for whom data was submitted, receiving regional center employment services.
Prevention & Wellness:
For adults served in residential services, how many received their preventative health screenings at the medically recommended age/frequency?
| Exam Type | On Time | Not on Time | No Data to Report | Total Records |
|---|---|---|---|---|
| Physical | 18,714 (89.1%) | 882 (4.2%) | 1,403 (6.7%) | 20,999 (100.0%) |
| Dental | 16,328 (70.4%) | 3,700 (16.0%) | 3,166 (13.7%) | 23,194 (100.0%) |
| Cervical Cancer | 2,074 (33.6%) | 394 (6.4%) | 3,700 (60.0%) | 6,168 (100.0%) |
| Breast Cancer | 2,013 (57.9%) | 193 (5.6%) | 1,268 (36.5%) | 3,474 (100.0%) |
| Colorectal Cancer | 2,084 (26.8%) | 408 (5.3%) | 5,276 (67.9%) | 7,768 (100.0%) |
Provider Capacity:
To what extent is the Direct Support Professional (DSP) workforce in California growing?
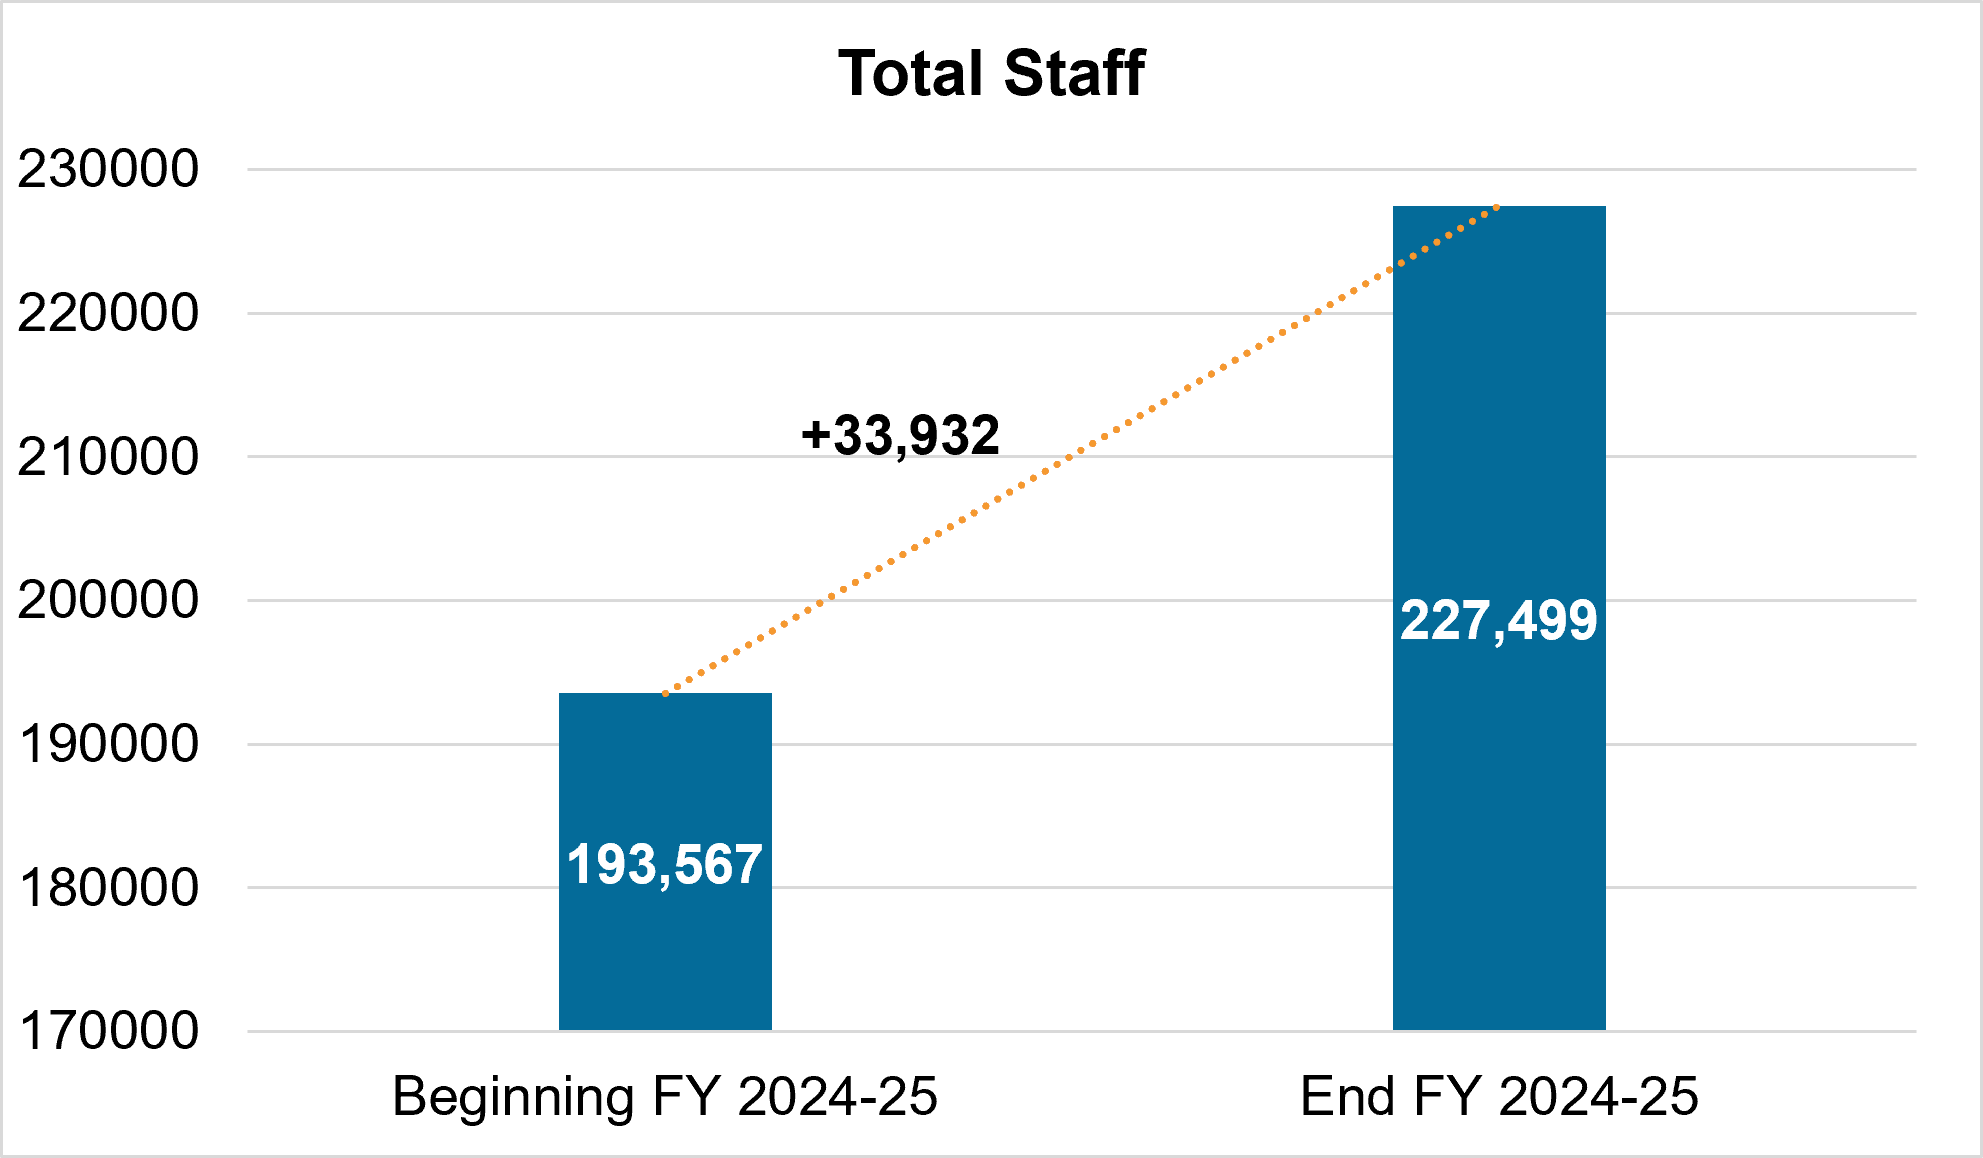
- The total number of DSPs reported by these providers grew by 33,932 between July 1, 2024 and June 30, 2025
- These providers reported having an average of 44 DSPs on July 1, 2024 and an average of 52 DSPs on June 30, 2025.
- This is an increase of 8 in the average number of DSPs employed by reporting providers in FY 2024-25
For a walkthrough of the data, please see our: June QIP Workgroup Meeting Recording.